“Don’t let the fear of losing be greater than the excitement of winning.”
– Robert Kiyosaki
The Capital Budgeting Decision (Part C)
by
Charles Lamson
 |
At times management may place an artificial constraint on the amount of funds that can be invested in a given period. This is known as capital rationing. The executive planning committee may emerge from a lengthy capital budgeting session to announce that only $5 million may be spent on new capital projects this year. Although $5 million may represent a large sum, it is still an artificially determined constraint and not the product of marginal analysis, in which the return for each proposal is related to the cost of capital for the firm, and projects with positive net present values are accepted. A firm may adopt a posture of capital rationing because it is fearful of too much growth or hesitant to use external sources of financing (perhaps there is a fear of debt). In a strictly economic sense, capital rationing hinders a firm from achieving maximum profitability. With capital rationing, as indicated in Table 7, acceptable projects must be ranked, and only those with the highest possible net present value are accepted. Under capital rationing, only projects A through C, calling for $5 million in investment, will be accepted. Although projects D&E have returns exceeding the cost of funds, as evidenced by a positive net present value, they will not be accepted with the capital rationing assumption. Net Present Value Profile An interesting way to summarize the characteristic of an investment is through the use of the net present value profile. The profile allows us to graphically portray the net present value of a project at different discount rates. Let's apply the profile to the Investments we have been discussing. The projects are summarized again below. To apply the net present value profile, you need to know three characteristics about an investment:
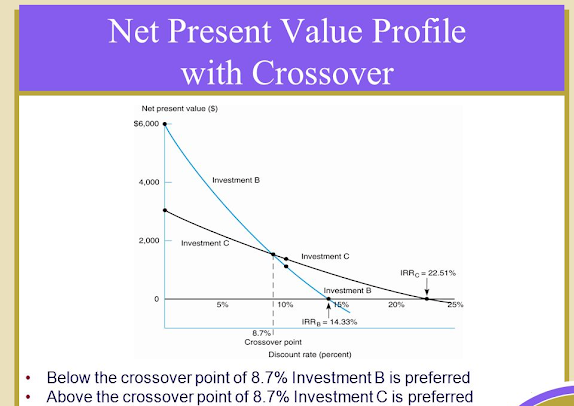
We summarize the information about discount rates and net present values for each investment below. Figure 2 In the current example, the net present value of Investment B was superior to Investment A at every point. This is not always the case in comparing various projects. To illustrate let's introduce a new project, Investment C, and then compare it with Investment B. Characteristics of Investment C
Comparing Investment B to Investment C in Figure 3, we observe that at low discount rates, Investment B has a higher net present value than Investment C. However, at high discount rates, Investment C has a higher net present value than Investment B. The actual crossover point can be viewed at approximately 8.7 percent. At lower rates below 8.7 percent. you would choose Investment B. At higher rates above 8.7 percent, you would select Investment C. Since the cost of capital is presumed to be 10 percent, you would probably prefer Investment C. Figure 3 Why does Investment B do well compared to Investment C at low discount rates and relatively poorly compared to Investment C at high discount rates? This difference is related to the timing of inflows. Let's examine the inflows as reproduced in the following table. Investment B has heavy late inflows ($5,000 in both the fourth and fifth years) and these are more strongly penalized by high discount rates. Investment C has extremely high early cash inflows and these hold up well with high discount rates.If the Investments are nonmutually exclusive or there is no capital rationing, we would probably accept both Investments B and C at discount rates below 14.33 percent, because they both would have positive net present values. If we can select only one, the decision may well turn on the discount rate. Observe and Figured 3 at a discount rate of 5 percent we would select Investment B, at 10 percent we would select Investment C, and so on. The net present value profile helps to make such decisions. In the next post, we turn back to basic capital budgeting issues. *MAIN SOURCE: BLOCK & HIRT, 2005, FOUNDATIONS OF FINANCIAL MANAGEMENT, 11TH ED., PP. 358-361* end |


No comments:
Post a Comment