“I’m only rich because I know when I’m wrong…I basically have survived by recognizing my mistakes.”
– George Soros
Risk and Capital Budgeting
by
Charles Lamson
 |
No one area is more essential to financial decision making than the evaluation and management of risk. The price of a firm's stock is to a large degree influenced by the amount of risk investors perceive to be inherent in the firm. A company is constantly trying to achieve the appropriate mix between profitability and risk to satisfy those with a stake in its affairs and to achieve wealth maximization for shareholders.
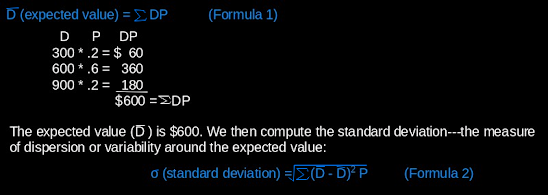
The difficulty is not in finding viable investment alternatives but in determining an appropriate position on the risk-return scale. Would a firm prefer a 20 percent potential return on an untried and new product or a safe 8 percent return on an extension of its current product line? The question can only be answered in terms of profitability, the risk position of the firm, and management and stockholder disposition toward risk. In the next several posts chapter we examine definitions of risk, its measurement and its incorporation into the capital budgeting process, and the basic tenets of portfolio theory. Definition of Risk in Capital Budgeting Risk may be defined in terms of the variability of possible outcomes from a given investment. If funds are invested in a 30-day U.S. Government obligation, the outcome is certain and there is no variability---hence no risk. If we invest the same funds in a gold-mining expedition to the deepest wilds of Africa, the variability of possible outcomes is great and we say the project is replete with risk. You should observe that that risk is measured not only in terms of losses but also in terms of uncertainty. We say gold mining carries a high degree of risk not just because you may lose your money but also because there is a wide range of possible outcomes. Observe in Figure 1 examples of three investments with different risk characteristics. Note that in each case the distributions are centered on the same expected value ($20,000), but the variability (risk) increases as we move from Investment A to Investment C. Because you may gain or lose the most in Investment C, it is clearly the riskiest of the three. Figure 1 Variability and risk The Concept of Risk Averse A basic assumption in financial theory is that most investors and managers are risk-averse---that is, for a given situation they would prefer relative certainty to uncertainty. In Figure 1, they would prefer Investment A over Investments B and C, although all three investments have the same expected value of $20,000. This is not to say investors or business people are unwilling to take risks---but rather that they will require a higher expected value or return for risky investments. In Figure 2, we compare a low-risk proposal with an expected value of $20,000 to a high-risk proposal with an expected value of $30,000. Higher expected return may compensate the investor for absorbing greater risk. Figure 2 Risk-return trade-off Actual Measurement of Risk A number of basic statistical devices may be used to measure the extent of risk inherent in any given situation. Assume we are examining an investment with the possible outcomes and probability of outcomes shown in Table 1. Table 1 Probability distribution of outcomes The probabilities in Table 1 may be based on past experience, industry ratios and trends, interviews with company executives, and sophisticated simulation techniques. The probability of values may be easy to determine for the introduction of a mechanical stamping process in which the manufacturer has 10 years of past data, but difficult to assess for a new product in a foreign market. In any event we force ourselves into a valuable analytical process. The following steps should be taken: The standard deviation of $190 gives us a rough average measure of how far each of the three outcomes Falls away from the expected value. Generally, the larger the standard deviation or spread of outcomes, the greater is the risk. If the expected values of the investments were different such as $600 versus $6,000, a direct comparison of the standard deviations for each distribution would not be helpful in measuring risk. A standard deviation of $600 on an investment with an expected value of $6,000 may indicate less risk than a standard deviation of $190 on an investment with an expected value of only $600. We can eliminate the size difficulty by developing a third measure, the coefficient of variation (V). This term calls for nothing more difficult than dividing the standard deviation of an investment by the expected value. Generally, the larger the coefficient of variation, the greater the risk. The formula for the coefficient of variation is Formula 3. For the investments just mentioned above in we show: We have correctly identified Investment B as carrying the greater risk. *MAIN SOURCE: BLOCK & HIRT, 2005, FOUNDATIONS OF FINANCIAL MANAGEMENT, 11TH ED., PP. 385-390* end |


No comments:
Post a Comment