“The Stock Market is designed to transfer money from the Active to the Patient.”
– Warren Buffett
The Capital Budgeting Decision (Part D)
by
Charles Lamson
Combining Cash Flow Analysis and Selection Strategy
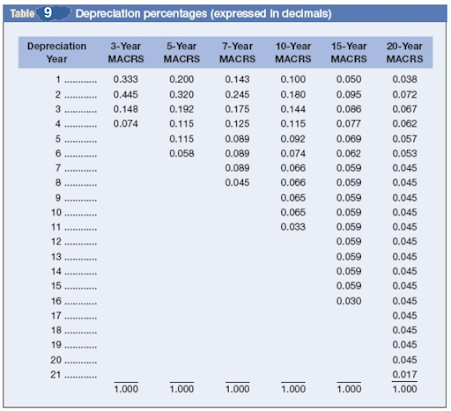
Many of the points that we have covered thus far will be reviewed in the context of a capital budgeting decision, in which we determine the annual cash flows from an investment and compare them to the initial outlay. To be able to analyze a wide variety of cash flow patterns, we shall first consider the types of allowable of depreciation. The Rules of Depreciation Assets are classified according to nine categories that determine the allowable rate of depreciation write-off. Each class is referred to as a "MACRS" category; MACRS stands for modified accelerated cost recovery system. Some references are also made to ADR, which stands for asset depreciation range, or the expected physical life of the asset or class of assets. Most assets can be written off more rapidly than the midpoint of their ADR. For example, an asset may have a midpoint of its ADR of 4 years, which means the middle of its expected useful life is 4 years; this asset might be written off over 3 years. Table 8 shows the various categories for depreciation, linking the depreciation write-off period to the midpoint of the ADR. Each of the nine categories in Table 8 has its own rate of depreciation that can be applied to the purchase price of the asset. We will direct our attention to the first six categories in table 8, which apply to assets normally used in business transactions. The last three categories relate to real estate investments and, for purposes of simplicity, will not be covered. The rates of depreciation that apply to the first six classes in Table 8 are shown in Table 9. The rates shown in Table 9 are developed with the use of the half-year convention, which treats all property as if it were put in service in mid-year. The half-year convention is also extended to the sale or retirement of an asset. Thus for three-year MACRS depreciation, there are four years of depreciation to be taken, as determined to below: For 5-year depreciation, there are six years to be taken, and so on. Let's return to Table 9, and assume you purchased a $50,000 asset that falls in the five-year MACRS category. How much would your depreciation be for the next 6 years? (Don't forget that we can get an extra year because of the half-year convention.) the depreciation schedule is shown in table 10. Table 10 Depreciation Schedule The Tax Rate Although the maximum quoted federal corporate tax rate is now 21 percent, it is almost certain to be changed again in the future, and very few pay this rate. Smaller corporations and those with big tax breaks for research and development, new asset purchases, or natural resource development may only pay taxes at a 15 to 20 percent rate. Large corporations with foreign tax obligations and special state levies may pay effective total taxes of 40 percent or more. In the following posts, we shall use a rate of 35 percent, but remember, the rate varies from situation to situation and from time period to time period. *MAIN SOURCE: BLOCK & HIRT, 2005, FOUNDATIONS OF FINANCIAL MANAGEMENT, 11TH ED., PP. 365-367* end |


No comments:
Post a Comment